NASA
Jet Propulsion Laboratory
California Institute of Technology
Skip Navigation
Ocean Surface Topography from Space
Stay Connected
menu
close modal
Resources
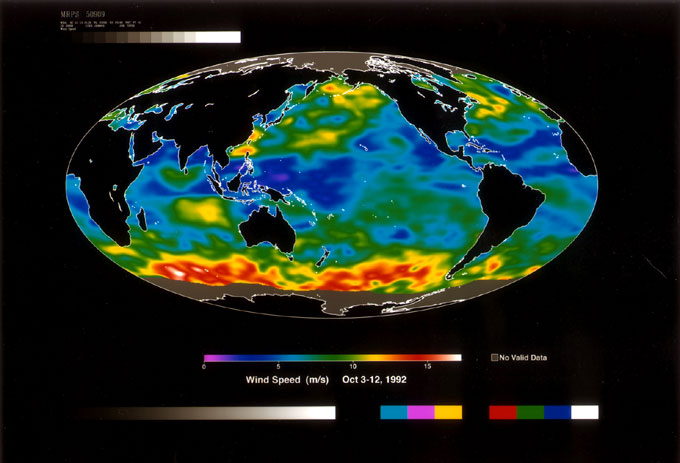
Wind Speed
Published:
September 13, 2010
Wind Speed
ENLARGE
Related
Jason-1: First Image
Jason-1: First Image
This visualization shows total sea level change between 1992 and 2019, based on data collected from the TOPEX/Poseidon, Jason-1, Jason-2, and Jason-3 satellites. Blue regions are where sea level ha...
27-year Sea Level Rise - TOPEX/JASON
The SpaceX Falcon 9 rocket carrying the Sentinel-6 Michael Freilich spacecraft lifts off from Space Launch Complex 4 at Vandenberg Air Force Base in California, Nov. 21, 2020, at 9:17 a.m. PST
Sentinel-6 Launch
Jason-1 launch images
Jason-1 launch images
SpaceX Falcon 9 rocket, topped with the Sentinel-6 Michael Freilich satellite secured inside its payload fairing, is rolled to Space Launch Complex 4
Sentinel-6 Rollout at SLC-4, VAFB
Ocean Dynamic Topography
Ocean Dynamic Topography
Jason-1 Artists Concept
Jason-1 Artists Concept
These photos were taken during the Payload Attach Fitting (PAF) mating operation with Jason-1. (11/14/01) Photos: Scott Michel
These photos were taken during the Payload Attach Fitting (PAF) mating operation with Jason-1. (11/14/01) Photos: Scott Michel
Altimeter Applications - JPL Open House '99
Altimeter Applications - JPL Open House '99
This is an artist's concept of the Sentinel-6 Michael Freilich spacecraft.
Artist's concept of Sentinel-6 Michael Freilich
The Antonov cargo aircraft carrying the Sentinel-6 Michael Freilich satellite touches down on the runway at Vandenberg Air Force Base in California on Sept. 24, 2020.
Sentinel-6 Spacecraft Arrival/Offload
This animation illustrates the evolution of sea surface temperature (SST) anomalies (relative to the respective normal state) in the Pacific Ocean associated with the 2015-2016 El Niño.
2015-2016 El Niño-Southern Oscillation Sea Surface Temperature Anomalies
Launch preparations are progressing! (11/21/01) Photos: Stacy Mitchell of John Hopkins APL/TIMED project
Launch preparations are progressing! (11/21/01) Photos: Stacy Mitchell of John Hopkins APL/TIMED project
These photos were taken during the Payload Attach Fitting (PAF) mating operation with Jason-1. (11/14/01) Photos: Scott Michel
These photos were taken during the Payload Attach Fitting (PAF) mating operation with Jason-1. (11/14/01) Photos: Scott Michel
OSTM/Jason-2 LRA
OSTM/Jason-2 LRA
Water Vapor
Water Vapor
Ariane 42P launch vehicle
Ariane 42P launch vehicle
OSTM/Jason-2 Radiometer Antenna
OSTM/Jason-2 Radiometer Antenna
Jason-1: TRSR instrument
Jason-1: TRSR instrument
Jason-1 Altimeter
Jason-1 Altimeter
TOPEX/Poseidon Altimeter
TOPEX/Poseidon Altimeter
Radiometer Install - Jan. 2007
Radiometer Install - Jan. 2007
Jason-1 Lithograph
Jason-1 Lithograph
Jason-1 Line Drawing
Jason-1 Line Drawing
The SpaceX Falcon 9 with the Sentinel-6 Michael Freilich satellite is lifted to vertical at Space Launch Complex 4
Sentinel-6 on pad at SLC-4, VAFB