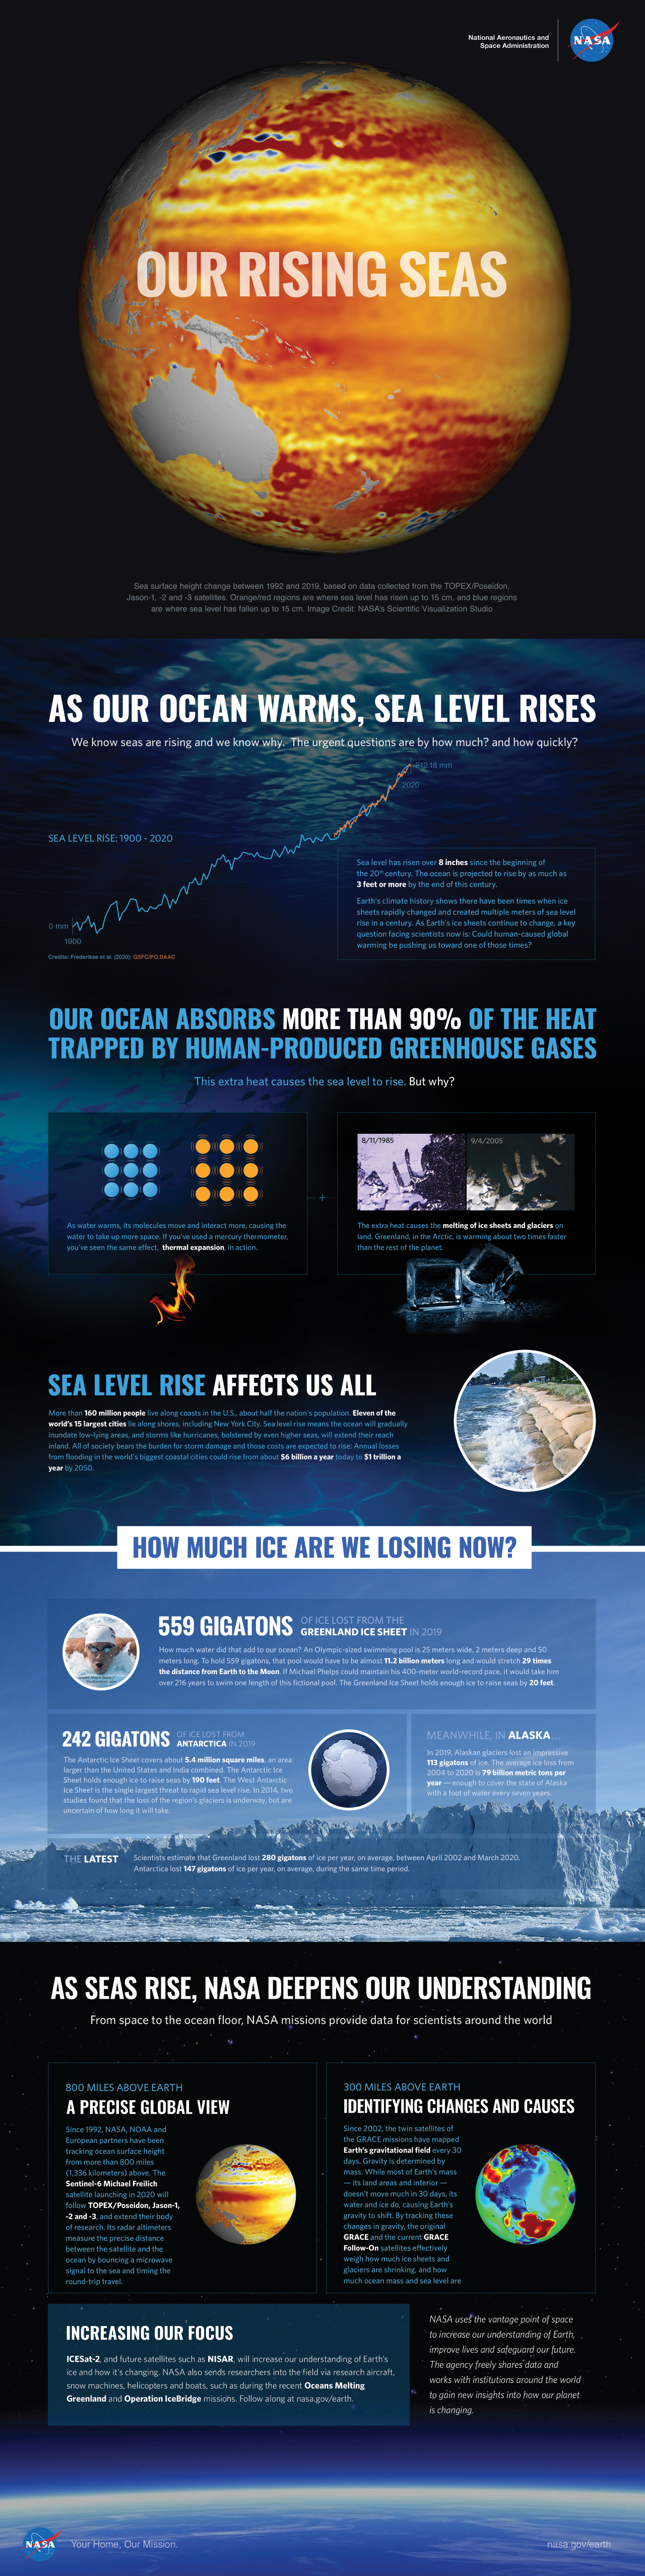
NASA
Jet Propulsion Laboratory California Institute of Technology
Skip Navigation
Ocean Surface Topography from Space
Stay Connected
menu close modal

Resources

Our Rising Seas

cover of brochure
Source: NASA JPL-Caltech
Published: August 25, 2020

Our Rising Seas infographic (version 2020)

ENLARGE

Downloads

Our Rising Seas infographic
28.3 MB
application/pdf
Download

More Like This

  • Graphics
  • Products
  • Application
  • Data

Related

Earth’s rising seas are some of the most visible signs of our warming planet. Over the last 23 years, NASA satellite missions have observed a steady rise in global sea levels as polar ice sheets me...
More
Earth's Rising Seas
Earth's Rising Seas
Whale Census and Habitat
More
Whale Census and Habitat
A look at how NASA is dealing with the threat of sea level rise to its coastal infrastructure.
More
A look at how NASA is dealing with the threat of sea level rise to its coastal infrastructure.
Rising Waters: Sea Level & NASA Infrastructure
Jason-1 Poster
More
Jason-1 Poster
Jason-1 Poster
El Niño is characterized by unusually warm ocean temperatures in the eastern equatorial Pacific. The warmer water associated with El Niño displaces colder water in the upper layer of the ocean caus...
More
Visualization: Sea Surface Height Anomaly, 2014-2016
Sea Surface Height Anomaly, 2014-2016
Bringing Satellite Data Down to Earth
More
Bringing Satellite Data Down to Earth
Estudio de seguimiento de la altura de los océanos para comprender el clima terrestre
More
Estudio de seguimiento de la altura de los océanos para comprender el clima terrestre
Growing up in landlocked Zimbabwe, NASA JPL engineer Shailen Desai was far from the ocean but still experienced its effects on the climate. Now, he is contributing to an international effort to tra...
More
Earth’s surface is covered by 70% ocean. Rising seas caused by climate change affect everyone across the globe, from coastal communities to those living inland. Growing up in landlocked Zimbabwe, NASA JPL engineer Shailen Desai was far from the ocean but still experienced its effects on the climate. Now, he is contributing to an international effort to track our rising seas.
NASA Engineer Helps Track the Global Impacts of Rising Seas
Variability of Ocean Dynamic Topography
More
Variability of Ocean Dynamic Topography
Sea Level
More
Sea Level
Sea Level
Wave Height
More
Wave Height
Wave Height
This animation illustrates the evolution of sea surface temperature (SST) anomalies (relative to the respective normal state) in the Pacific Ocean associated with the 2015-2016 El Niño.
More
El Niño-Southern Oscillation Sea Surface Temperature Anomalies, 2015-2016
2015-2016 El Niño-Southern Oscillation Sea Surface Temperature Anomalies
Sea Surface Height
More
Sea Surface Height
Sea Surface Height
Measuring El Niño & La Niña - JPL Open House '99 Display
More
Measuring El Niño & La Niña - JPL Open House '99 Display
A Year in the Life Of El Niño
More
A Year in the Life Of El Niño
This visualization shows total sea level change between 1992 and 2019, based on data collected from the TOPEX/Poseidon, Jason-1, Jason-2, and Jason-3 satellites. Blue regions are where sea level ha...
More
Visualizations showing sea surface height change over the past 27 years, in various formats.
27-year Sea Level Rise - TOPEX/JASON
On the left is Sea Surface Height Anomalies (SSHA) relative to the sea level mean (1993-2018). On the right is Global Mean Sea Level (GMSL) with the sea level trend as the straight line. The data a...
More
video of sea surface height anomalies and rising graph
Sea Surface Height Anomalies and Global Mean Sea Level
TOPEX/Poseidon Sticker
More
TOPEX/Poseidon Sticker
Ocean Dynamic Topography
More
Ocean Dynamic Topography
Launched on January 17, 2016, Jason-3 is a partnership that includes NOAA, NASA, CNES, and EUMETSAT.  The map shown here was generated using sea surface height measurements from the first 10 days (...
More
Jason-3 Begins Mapping the Ocean
El Niño Poster
More
El Niño Poster
El Niño Poster
Jason-1 with 3 Ships
More
Jason-1 with 3 Ships
Jason-1 Fact Sheet
More
Jason-1  Fact Sheet
Jason-1 Fact Sheet
Changing conditions in the Pacific have stirred up Earth’s largest ocean and redistributed its heat, piling up warm waters along U.S. Western shores and raising sea level in the process.
More
Changing conditions in the Pacific have stirred up Earth’s largest ocean and redistributed its heat, piling up warm waters along U.S. Western shores and raising sea level in the process.
Rising Waters on the West Coast
Ocean Dynamic Topography
More
Ocean Dynamic Topography
more resources

Get the Newsletter

Follow JPL

Home

Ocean Observation

    • Why Study the Ocean?
    • Understanding Climate
    • Ocean Surface Topography

Science

    • Goals & Objectives
    • Publications
    • Scientific Investigations
    • Science Team Meetings

Applications

    • Overview
    • Water Cycle
    • Operational
    • Coastal
    • Biological
    • Climate
    • Hazards

Data

    • Get Data
    • Along-Track Near Real-Time Data
    • El Niño/La Niña Watch & PDO
    • Vital Signs

Missions

    • Overview
    • Technology
    • Jason-CS (Sentinel 6)
    • Jason-3
    • OSTM/Jason-2
    • Jason-1
    • TOPEX/Poseidon

News

Resources

  • NASA
  • |
  • CALTECH
  • |
  • Privacy
  • |
  • Image Policy
  • |
  • Feedback
  • |
  • Accessibility

Site Manager: Kalina Velev