NASA
Jet Propulsion Laboratory
California Institute of Technology
Skip Navigation
Ocean Surface Topography from Space
Stay Connected
menu
close modal
Resources
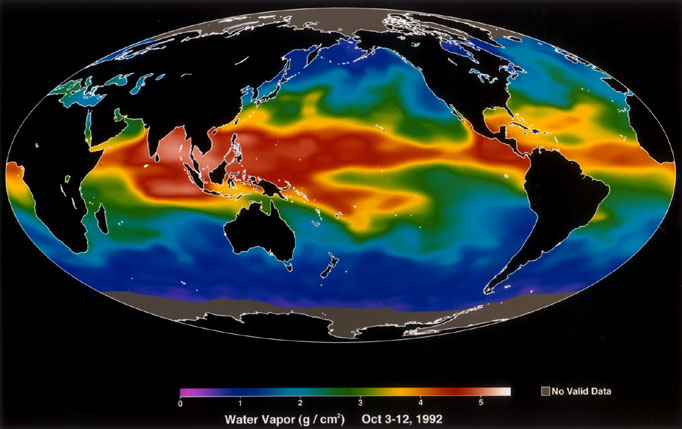
Water Vapor
Published:
September 13, 2010
Water Vapor
ENLARGE
Related
Jason-3 Lifts Off!
Jason-3 Lifts Off!
t - 10 minutes
t - 10 minutes
Wind Speed
Wind Speed
The SpaceX Falcon 9 rocket, topped with the Sentinel-6 Michael Freilich satellite secured inside its payload fairing, is rolled to Space Launch Complex 4
Sentinel-6 Rollout at SLC-4, VAFB
Early morning at the launch pad
Early morning at the launch pad
Jason-1: JMR instrument
Jason-1: JMR instrument
These photos were taken during the Payload Attach Fitting (PAF) mating operation with Jason-1. (11/14/01) Photos: Scott Michel
These photos were taken during the Payload Attach Fitting (PAF) mating operation with Jason-1. (11/14/01) Photos: Scott Michel
This is an artist's concept of the Sentinel-6 Michael Freilich spacecraft.
Artist's concept of Sentinel-6 Michael Freilich
In this illustration, the Sentinel-6 Michael Freilich spacecraft - the world's latest sea-level satellite - orbits Earth with its deployable solar panels extended.
Sentinel-6 Michael Freilich Satellite Orbits Earth (Illustration)
The SpaceX Falcon 9 rocket carrying the Sentinel-6 Michael Freilich spacecraft lifts off from Space Launch Complex 4 at Vandenberg Air Force Base in California, Nov. 21, 2020, at 9:17 a.m. PST
Sentinel-6 Launch
Radiometer Install - Jan. 2007
Radiometer Install - Jan. 2007
These photos were taken during the Dual Payload Attach Fitting (DPAF) mating operation with Jason-1. (11/13/01) Photos: Scott Michel
These photos were taken during the Dual Payload Attach Fitting (DPAF) mating operation with Jason-1. (11/13/01) Photos: Scott Michel
Jason-1 readies for launch in its bay at Vandenberg, AFB (10/31/01)
Jason-1 readies for launch in its bay at Vandenberg, AFB (10/31/01)
Launch preparations are progressing! (11/21/01) Photos: Stacy Mitchell of John Hopkins APL/TIMED project
Launch preparations are progressing! (11/21/01) Photos: Stacy Mitchell of John Hopkins APL/TIMED project
TOPEX/Poseidon Altimeter
TOPEX/Poseidon Altimeter
The Falcon 9 protective payload fairing containing the Sentinel-6 Michael Freilich satellite
Payload fairing containing the Sentinel-6 Michael Freilich satellite
Jason-1 Launch - Artists Concept
Jason-1 Launch - Artists Concept
Launch preparations are progressing! (11/21/01) Photos: Stacy Mitchell of John Hopkins APL/TIMED project
Launch preparations are progressing! (11/21/01) Photos: Stacy Mitchell of John Hopkins APL/TIMED project
Inside half of the Delta Clam shell faring
Inside half of the Delta Clam shell faring
High Resolution Jason-1 launch images
High Resolution Jason-1 launch images
Poseidon-3 Altimeter
Poseidon-3 Altimeter
OSTM/Jason-2 Spacecraft
OSTM/Jason-2 Spacecraft
Jason-1 launch images
Jason-1 launch images
Launch preparations are progressing! (11/21/01) Photos: Stacy Mitchell of John Hopkins APL/TIMED project
Launch preparations are progressing! (11/21/01) Photos: Stacy Mitchell of John Hopkins APL/TIMED project
t - 12 minutes
t - 12 minutes