El Niño/La Niña Watch & PDO
El Niño 2023
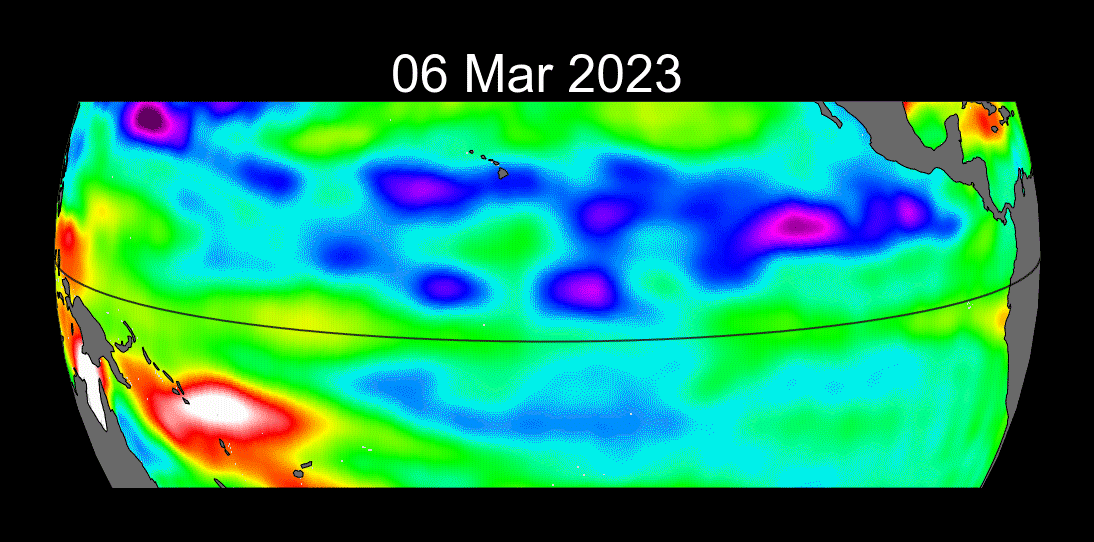
This animation shows the ongoing progress of the 2023 El Niño event. Like the historical images, these data are processed to remove the natural yearly cycle, and also the long-term trend caused by human interference with the climate. The remaining images show bursts of high sea level (red colors) moving eastward along the equator and building up warm water (and higher sea levels) in the far eastern Pacific. These traveling bursts of high sea level, called Kelvin waves, typically precede an El Nino event. This animation will continue to be updated as the 2023 event develops.
Press Release(s):
- NASA Analysis Sees Spike in 2023 Global Sea Level Due to El Niño (March 21, 2024)
- International Ocean Satellite Monitors How El Niño Is Shaping Up (Oct. 18, 2023)
- International Sea Level Satellite Spots Early Signs of El Niño (May 12, 2023)
Update: January 2024

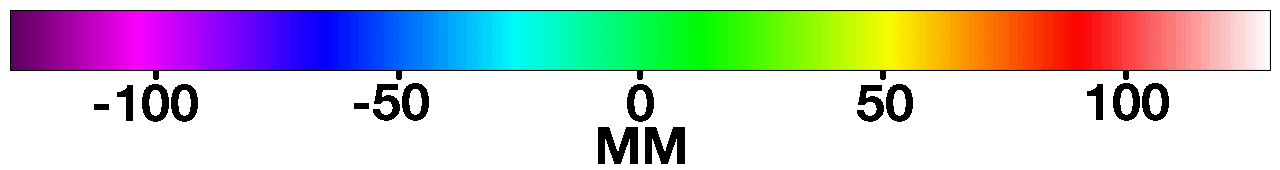
The 2023 El Niño grew through November as Kelvin waves propagated along the equator. At it’s peak in November, however, the intensity of this year’s El Niño did not quite match that of the largest events in recent decades. These images show the 2023 El Niño in January compared to the record-setting events of 1997 and 2015 at similar times of the season. In the previous events, sea levels were much higher, and these high sea levels (shown as red and white regions) were spread over a much larger area of the central and eastern Pacific. Note that the color scale on these images has been expanded to depict the 1997 and 2015 events more clearly.
In addition, the low sea levels of the western equatorial Pacific are not as low as in the 1997 or 2015 events. Low sea levels are usually associated with cold waters, and are depicted by dark blues and purples. This indicates that, while the impacts of the 2023 El Niño may be strongly felt in the tropics, its global impact may not be as far reaching or long lasting as in 1997 or 2015.

The slider below allows for a direct comparison between the 2015 and 2023 El Niños during January 2024. This slider will be updated monthly as the 2023 event continues to evolve.


2023 and 2015 El Niños