News | November 15, 2022
NASA Study: Rising Sea Level Could Exceed Estimates for U.S. Coasts
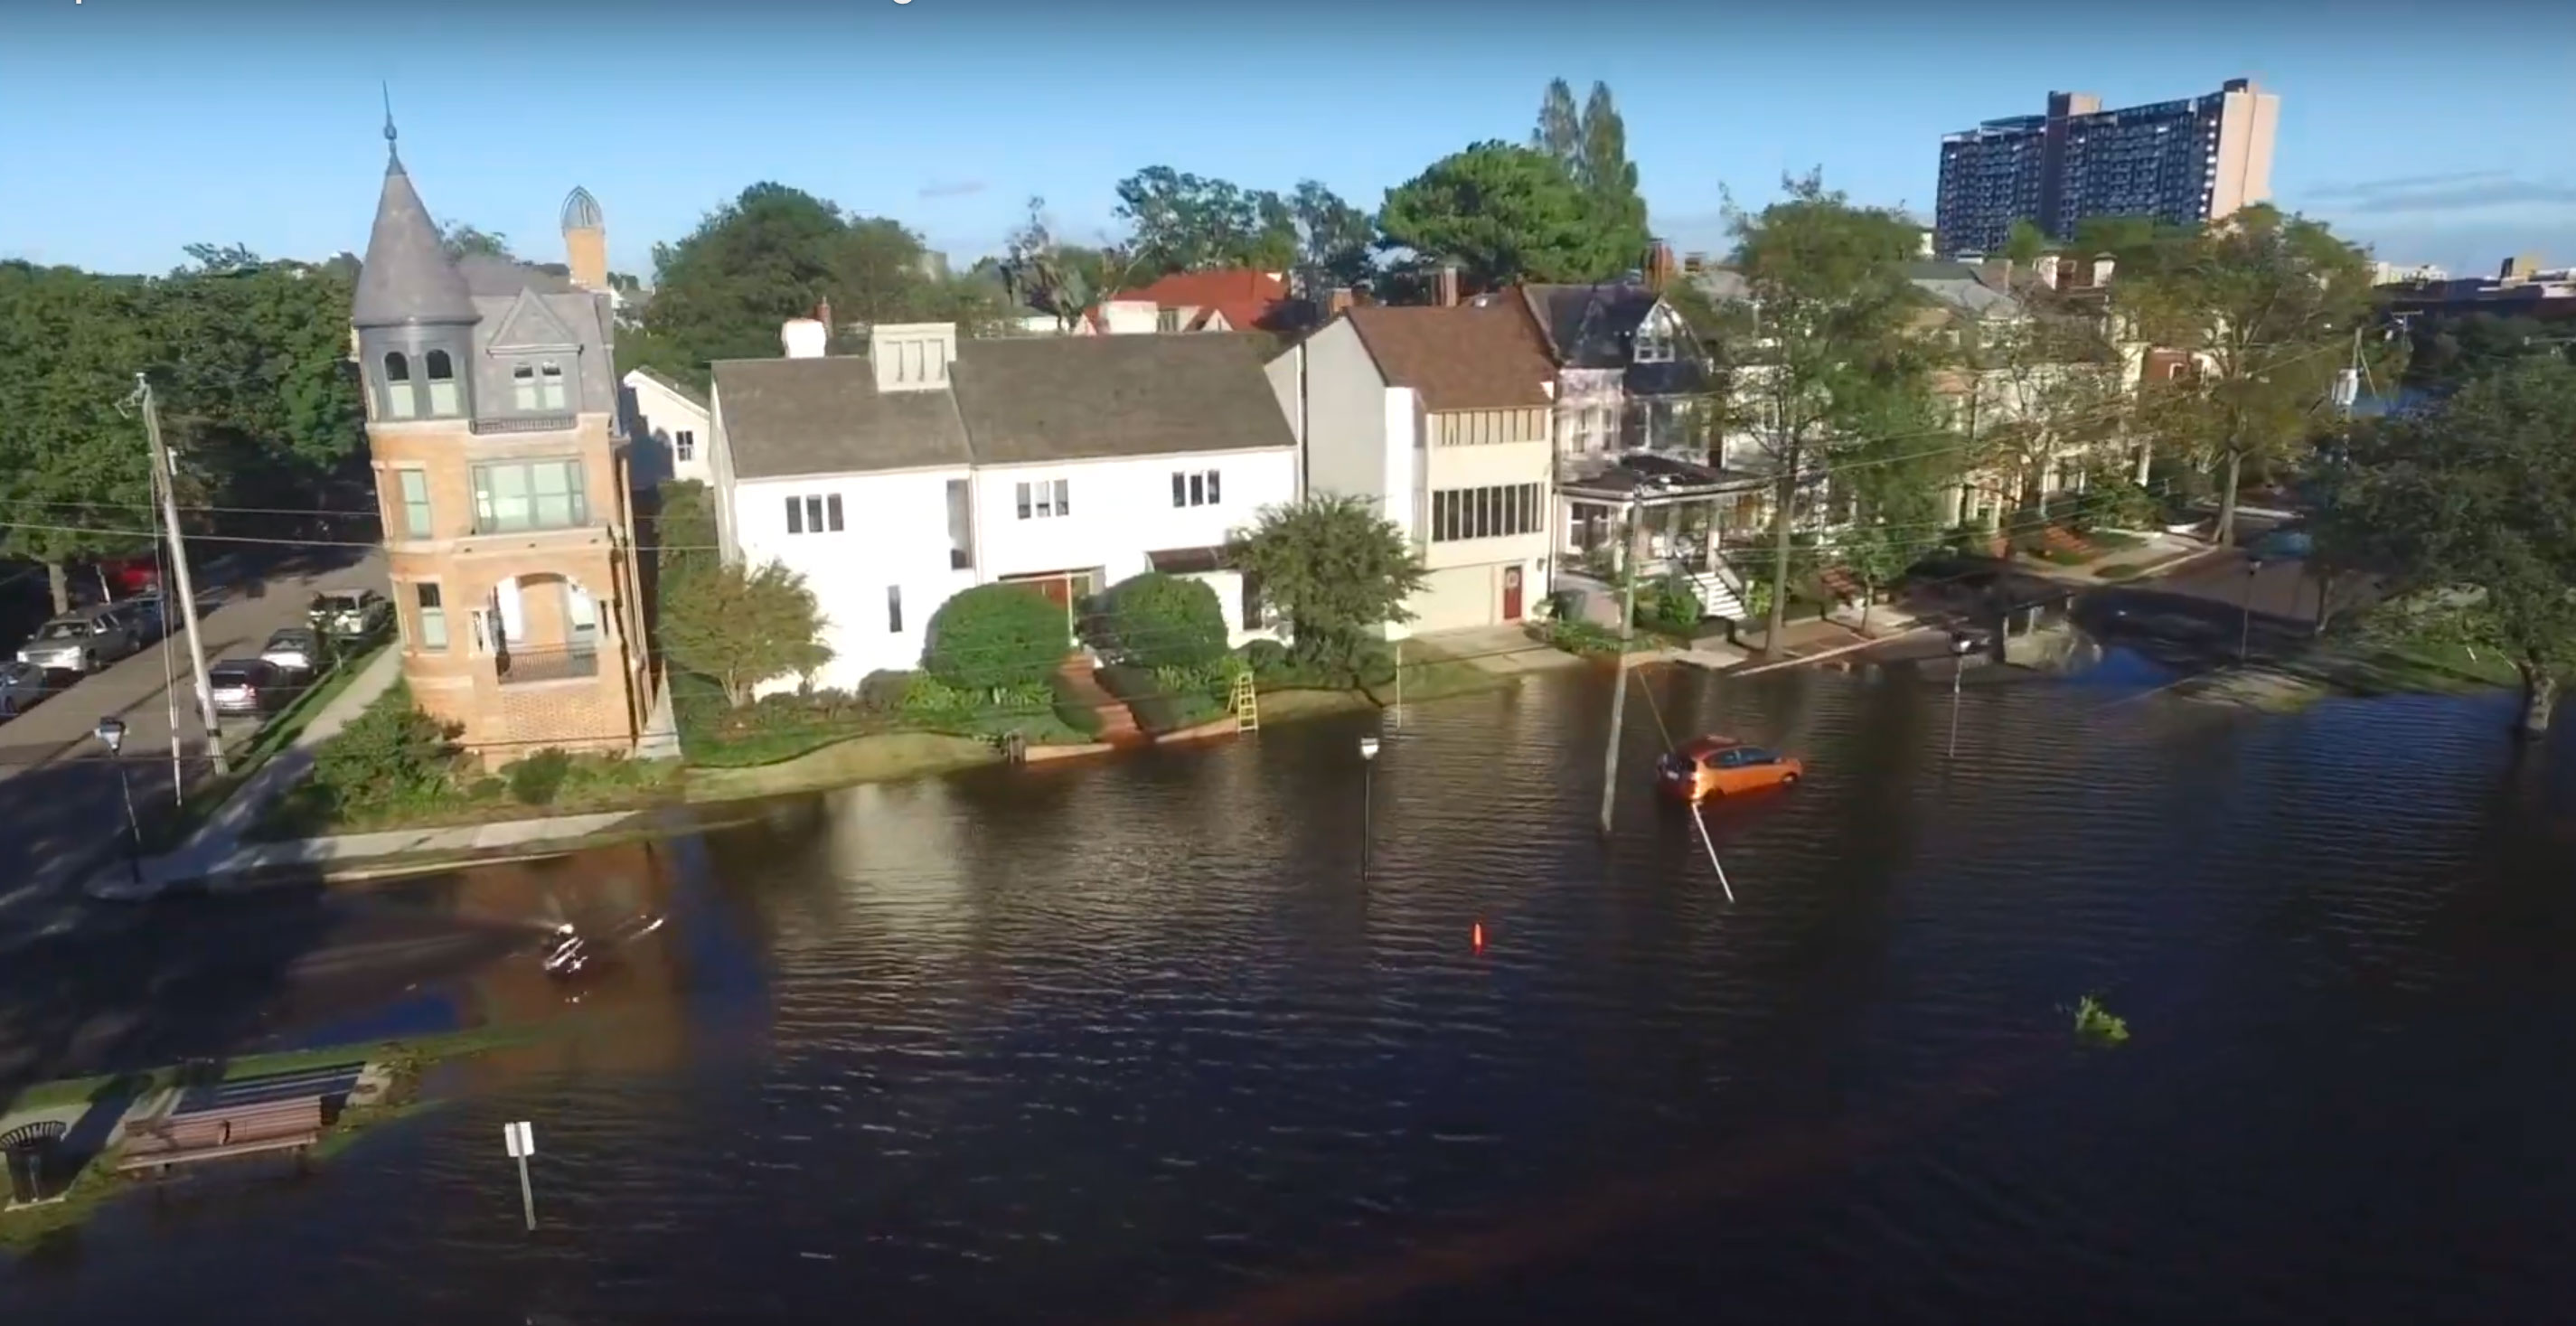
In the next few decades rising sea will lead to increased storm and tidal flooding for millions of Americans in coastal communities. Norfolk, Virginia, is pictured here with an inundated roadway.
Credit: City of Norfolk
New results show average sea level rise approaching the 1-foot mark for most coastlines of the contiguous U.S. by 2050. The Gulf Coast and Southeast will see the most change.
By 2050, sea level along contiguous U.S. coastlines could rise as much as 12 inches (30 centimeters) above today’s waterline, according to researchers who analyzed nearly three decades of satellite observations. The results from the NASA Sea Level Change Team could help refine near-term projections for coastal communities that are bracing for increases in both catastrophic and nuisance flooding in coming years.
Global sea level has been rising for decades in response to a warming climate, and multiple lines of evidence indicate the rise is accelerating. The new findings support the higher-range scenarios outlined in an interagency report released in February 2022. That report, developed by several federal agencies – including NASA, the National Oceanic and Atmospheric Administration (NOAA), and the U.S. Geological Survey – expect significant sea level rise over the next 30 years by region. They projected 10 to 14 inches (25 to 35 centimeters) of rise on average for the East Coast, 14 to 18 inches (35 to 45 centimeters) for the Gulf Coast, and 4 to 8 inches (10 to 20 centimeters) for the West Coast.

Building on the methods used in that earlier report, a team led by scientists at NASA’s Jet Propulsion Laboratory in Southern California leveraged 28 years of satellite altimeter measurements of sea surface height and correlated them with NOAA tide gauge records dating as far back as 1920. By continuously measuring the height of the surrounding water level, tide gauges provide a consistent record to compare with satellite observations.

The researchers noted that the accelerating rate of sea level rise detected in satellite measurements from 1993 to 2020 – and the direction of those trends – suggest future sea level rise will be in the higher range of estimates for all regions. The trends along the U.S. Southeast and Gulf coasts are substantially higher than for the Northeast and West coasts, although the range of uncertainty for the Southeast and Gulf coasts is also larger. This uncertainty is caused by factors such as the effects of storms and other climate variability, as well as the natural sinking or shifting of Earth’s surface along different parts of the coast.
“A key takeaway is that sea level rise along the U.S. coast has continued to accelerate over the past three decades,” said JPL’s Ben Hamlington, leader of the NASA Sea Level Change Team and a co-author of both the new study and the earlier report.
Hamlington noted that the team wanted to determine if they could refine sea level estimates for communities facing imminent changes. “We’ve been hearing from practitioners and planners along the coasts that they need more information on shorter timescales – looking not 70 or 80 years into the future, but looking 20 or 30 years into the future,” he said. “The bottom line is that when looking ahead to what we might experience in coming years, we need to consider these higher possibilities.”
Shift in High-Tide Flooding
The hazards of rising sea level are amplified by natural variabilities on Earth.
For instance, by the mid-2030s, every U.S. coast will experience more intense high-tide floods due to a wobble in the Moon’s orbit that occurs every 18.6 years. Hamlington said that this lunar cycle, in combination with rising sea level, is projected to worsen the impacts of high-tide flooding during the 2030s and 2040s.
Year-to-year variabilities such as the effects of El Niño and La Niña also can make it challenging to forecast how high and how fast sea levels will rise annually. Hamlington said forecasts will continue to be refined as satellites contribute more data over time.
NASA and France’s space agency Centre National d’Études Spatiales (CNES) started jointly flying satellite altimeters in the early 1990s, beginning a continuous space-based record of sea surface height with high accuracy and near-global coverage. That legacy continues with 2020 launch of the joint U.S.- European Sentinel-6 Michael Freilich mission and its altimeter, which will provide scientists with an uninterrupted satellite record of sea level surpassing three decades. The mission is a partnership between NASA, NOAA, ESA (European Space Agency), the European Organisation for the Exploration of Meteorological Satellites, and CNES.
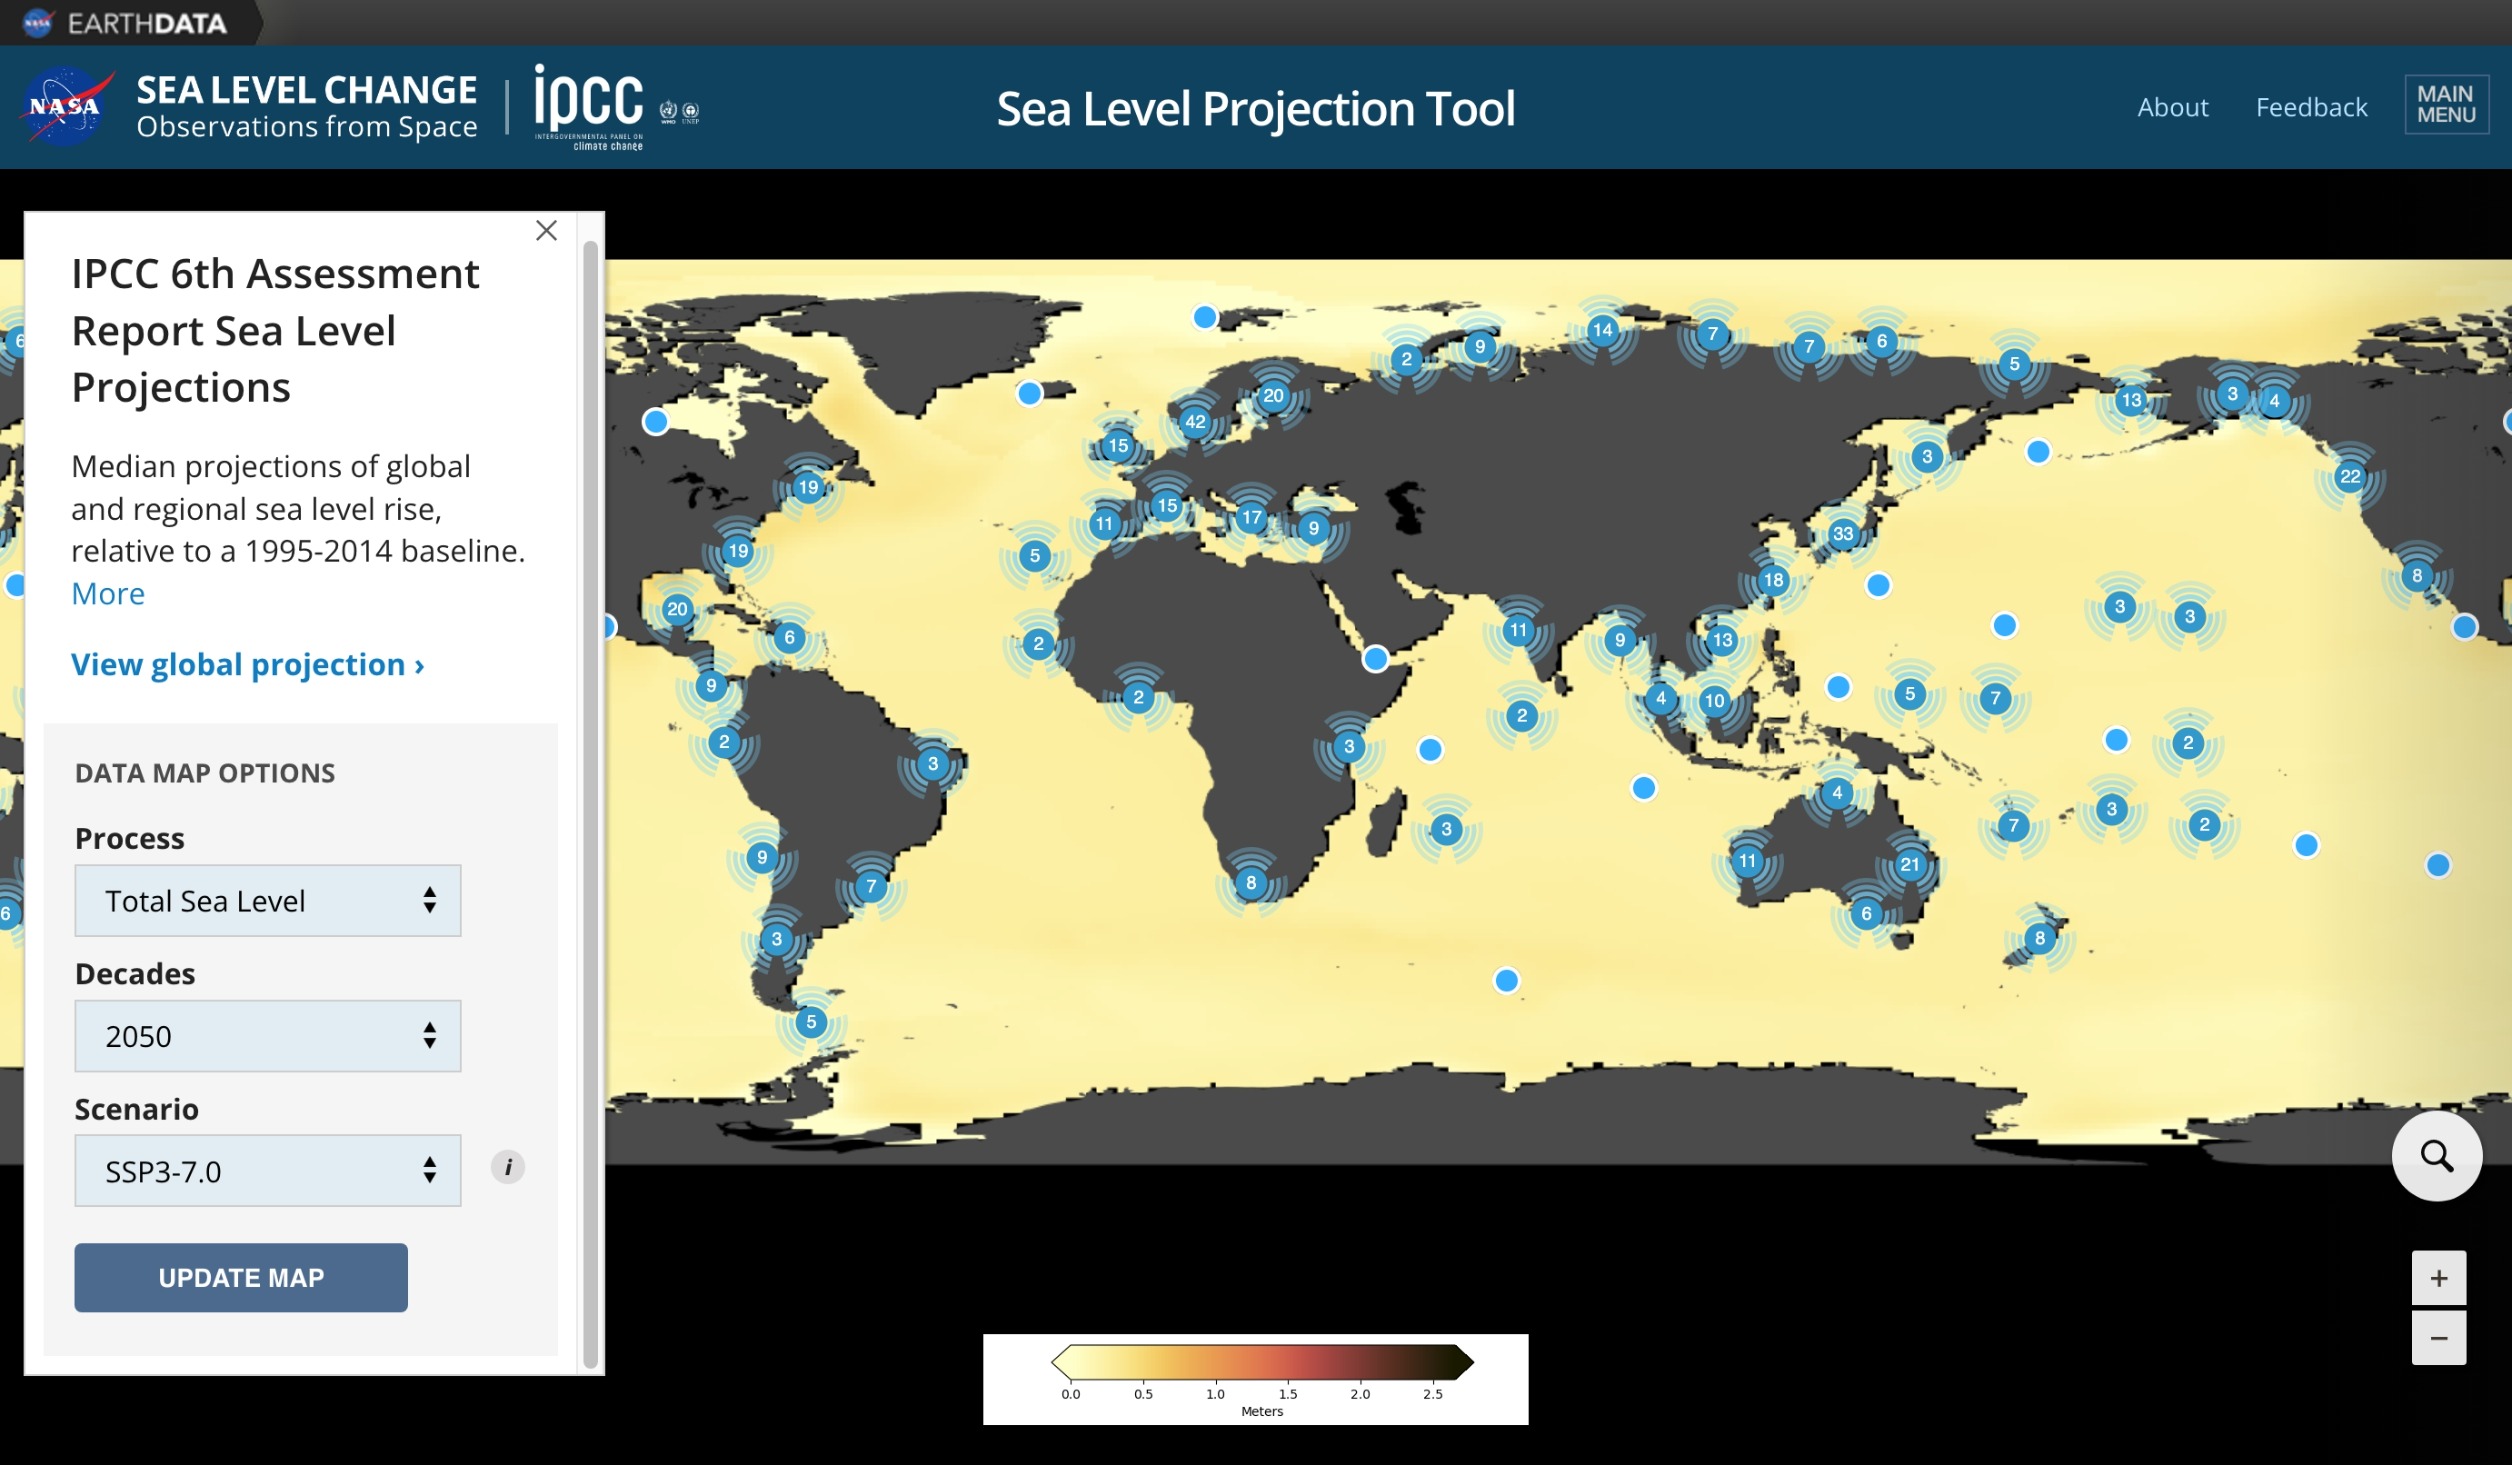
NASA sea level researchers have long worked to understand how Earth’s changing climate affects the ocean. Along with launching satellites that contribute data to the long global record of sea surface height, NASA-supported scientists look to understand the causes of sea level change globally and regionally. Through testing and modeling they work to forecast how much coastal flooding U.S. communities will experience by the mid-2030s and provide an online visualization tool that enables the public to see how specific areas will be affected by sea level rise. Agencies at the federal, state, and local levels use NASA data to inform their plans on adapting to and mitigating the effects of sea level rise.
Learn more about sea level and climate change:
News Media Contact
Jane J. Lee / Andrew Wang
Jet Propulsion Laboratory, Pasadena, Calif.
818-354-0307 / 626-379-6874
jane.j.lee@jpl.nasa.gov / andrew.wang@jpl.nasa.gov
Written by Sally Younger
2022-175