News | October 25, 2012
ENSO, sea level rise, Jason and GRACE
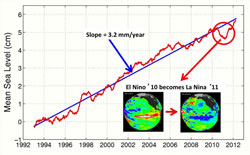
Global mean sea level from altimetry from 1992 to 2012 with annual and semi-annual variations removed and smoothed with a 60-day running mean filter [Nerem et al., 2010]. The slope of the trend (blue line) is 3.2 mm/year after a GIA correction has been applied (0.3 mm/year). The inset maps show sea surface height anomaly relative to the background trend and seasonal climatology, for 10-day averages centered on Jan 3, 2010 (near the peak of the El Niño) and Dec 29, 2010 (the peak of La Niña). Image from Boening et al., 2012.
While sea level is rising on long time scales, temporary fluctuations over the course of a few months related to climate variability can occur. In mid 2010 to mid 2011, global mean sea level (GMSL) dropped by ~5 mm (Figure 1). By “weighing“ the ocean using the Gravity Recovery And Climate Experiment (GRACE) satellites, the source of this sudden decrease can be determined. Was there less water in the ocean or was it temporarily cooler than normal?
Read the full story:
GRACE – Uncovering the 2010-11 decline in global mean sea level and its relation to ENSO
Related Story:
What Goes Down Must Come Back Up