Perpetual Ocean
http://gizmodo.com/5896376/time+lapse-of-ocean-currents-looks-like-a-living-van-gogh-painting
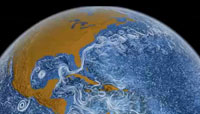
Driven by wind and other forces, currents on the ocean surface cover our planet. Some span hundreds to thousands of miles across vast ocean basins in well-defined flows. Others are confined to particular regions and form slow-moving, circular pools. Seen from space, the circulating waters offer a study in both chaos and order.
These visualizations, based on ocean temperature, salinity, sea surface height and sea ice data collected during field observations and by NASA satellites between July 2005 and December 2007, highlight many of the world's most important ocean surface currents. Watch powerful, fast-moving currents like the Gulf Stream in the Atlantic Ocean and the Kuroshio in the Pacific Ocean carry warm waters northeastward at speeds greater than 4 mph. View coastal currents such as the Agulhas in the Southern Hemisphere transporting equatorial waters from the Indian Ocean farther southwards.
Images and additional formats:
*
http://svs.gsfc.nasa.gov/vis/a010000/a010800/a010841/index.html
Additional articles:
*
http://www.guardian.co.uk/news/datablog/2012/mar/28/nasa-animations-perpetual-oceans-moon
*
http://cosmiclog.msnbc.msn.com/_news/2012/03/28/10909814-visualize-the-seas-and-space
Flat Map Ocean Current Flows with Sea Surface Temperatures (SST)
http://svs.gsfc.nasa.gov/vis/a000000/a003800/a003821/index.html
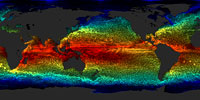
This visualization shows ocean current flows on a flat map of the world. This simple flat map (cylindrical equidistant projection) is designed to be easily wrapped to a sphere. The flows are colored by sea surface temperatures with blues being cooler waters and yellows/reds warmer waters. The time period for this visualization is 10 January 2005 through 2006. For each second that passes in the visualization, about 2.5 days pass.
This visualization was produced using model output from the joint MIT/JPL project: Estimating the Circulation and Climate of the Ocean, Phase II or ECCO2. ECCO2 uses the MIT general circulation model (MITgcm) to synthesize satellite and in-situ data of the global ocean and sea-ice at resolutions that begin to resolve ocean eddies and other narrow current systems, which transport heat and carbon in the oceans.