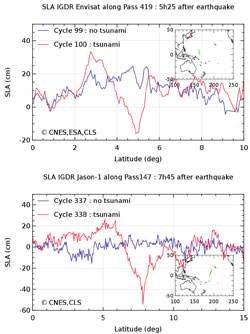
IGDR SLA for Envisat pass 419 (top) and Jason-1 pass 147 (bottom) for the cycle during the tsunami (in red) and the previous cycle (in blue) (Credits CNES/ESA/CLS).
On 11th March 2011, a 9.0-magnitude earthquake off Japan's north-eastern coast generated a huge wave which, breaking on the shore, devastated everything in its path. By measuring sea surface height or roughness, altimetry satellites can theoretically detect tsunami waves in the open ocean.
Shifting plates
In the Pacific Ocean, where the tsunami of 11th March 2011 occurred, the Pacific tectonic plate is forced beneath the less dense North America plate. As these plates converge, with one sliding beneath the other, they gradually become distorted through the subduction movement of 85 mm/year, at the same time accumulating a huge amount of pressure. When a certain threshold is reached, it causes a sudden break in the fault which instantly releases all the stored energy, triggering an earthquake of enormous magnitude. In the case of the Japan tsunami, the fault line moved upwards by 30-40 m along a 300 km stretch. When this phenomenon occurs, the abrupt movement of the fault causes the sea bottom to rise and the water's surface to deform, although its low amplitude (just a few tens of centimetres) makes it barely detectable at the time. The resulting wave spreads across the ocean basin at a speed approaching 800 km/h. When the waves approach the coasts, the reduced depth of the ocean forces them to slow down. This loss of velocity translates into an increase in wave height. Particular geographical characteristics of the coastline can have a channelling effect, causing resonance phenomena and amplifying wave size even further.
Altimetry measures height and roughness
By measuring sea surface height, altimetry satellites can theoretically detect the relatively small amplitude of tsunami waves in the open ocean if they overfly the waves within the few hours after the earthquake and if the signal is strong enough to be isolated from ocean variability. Due to this low probability, altimetry satellites do not form part of a tsunami early warning system.
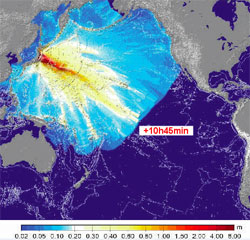
Forecast of the wave amplitude and time of propagation computed by the CEA model (Credits CEA).
With the tsunami of 11th March 2011, three altimetry satellites (Jason-1, Envisat and Jason-2) observed the front wave over the Pacific Ocean between 5 and 22 hours after the earthquake. The two examples given here were made with the IGDR data (+ 3 days).
Envisat detected the first wave front 5 hours and 25 min after the earthquake with a trough-to-crest amplitude of up to 50 cm. Jason-1 measured a larger amplitude (60 cm), 7 hours and 45 min after the earthquake.
Ocean surface roughness measured by altimeters can also be used to detect tsunamis away from the shore (Godin et al., 2009). Indeed, statistical analyses of multiple years of satellite altimeter observations have demonstrated, in the case of the Sumatra-Andaman tsunami (2004), distinctive variations in backscatter coefficient (σ0). This method can be adapted to other kinds of sensors (radiometers, scatterometers) measuring, not at nadir point along the track, but over broader swaths, and may be an important element in a future system for tsunami detection and warning.
Helping to Predict Tsunami Wave Heights
These altimetry results are currently being used to compare and validate the forecast models. According to the close correlation or the discrepancies between altimeter observations and model predictions, other effects may be tested in models to further improve the simulation of tsunami propagation and dissipation.
References:
Godin, O. A., et al.: Variations in sea surface roughness induced by the 2004 Sumatra-Andaman tsunami, Nat. Hazards Earth Syst. Sci., 9, 1135-1147, doi:10.5194/nhess-9-1135-2009, 2009.